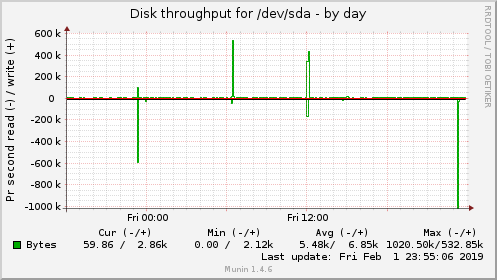
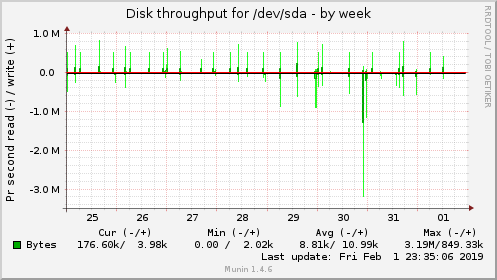
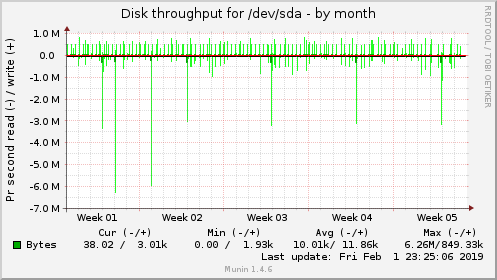
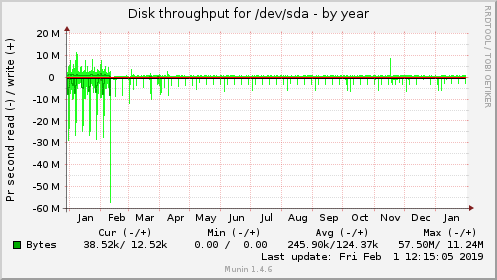
| This graph shows disk throughput in bytes pr ${graph_period}. The graph base is 1024 so KB is for Kibi bytes and so on. | |||||
| Field | Internal name | Type | Warn | Crit | Info |
|---|---|---|---|---|---|
| Bytes | wrbytes | gauge | |||
Overview :: hmsinc.com :: quicksilver.hmsinc.com :: diskstats_throughput :: sda |
|
|
||||||||||||||||||
|
|
||||||||||||||||||
|
|||||||||||||||||||
| Overview :: hmsinc.com :: quicksilver.hmsinc.com :: diskstats_throughput :: Disk :: | |||||||||||||||||||
| This page was generated by Munin version 1.4.6 at 2019-02-01 23:52:23-0500 (EST) |